Weeknotes: 9th November 2026
Habitat map work
On the habitat map work I went back to the input stages again, and actually did a bunch of data-spelunking. This meant quite a few days of just looking at dots on maps and asking why is that dot that colour and another another colour, the colour being the assumed habitat at that point from species obsevations.
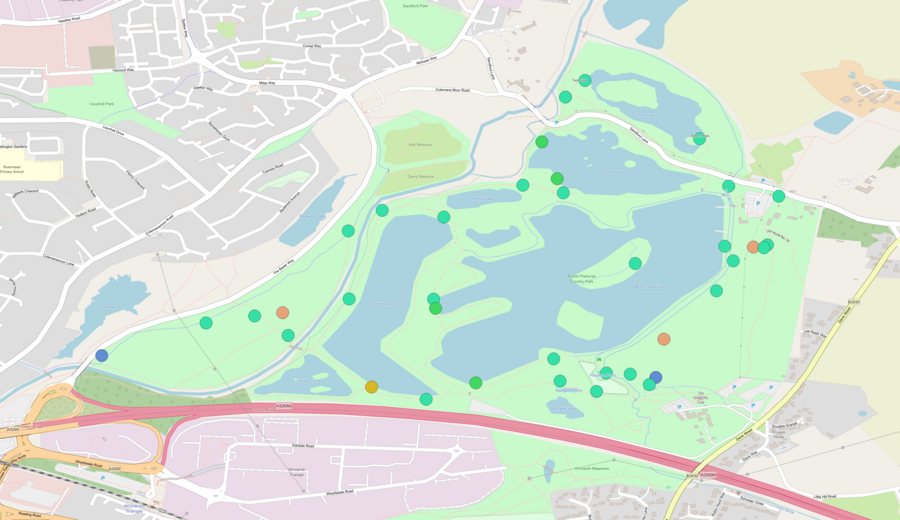
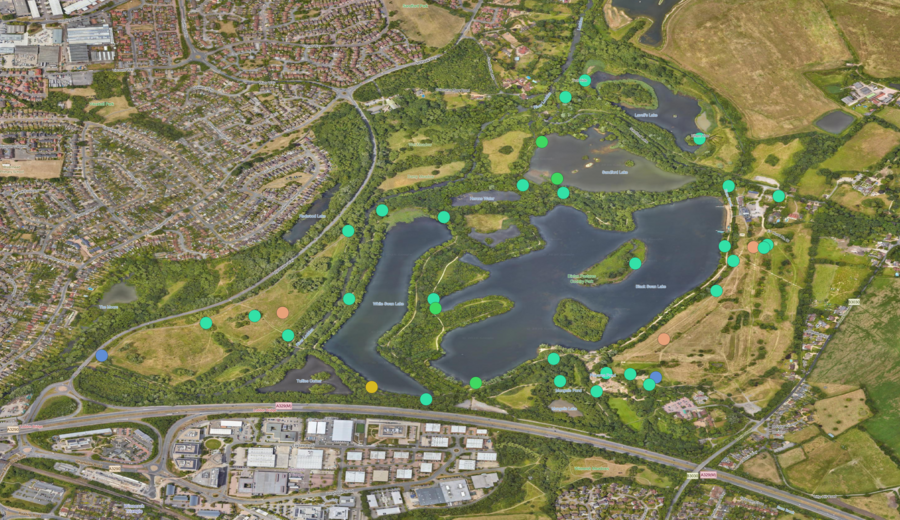 OSM with occurrencesSatellite with occurrences
This lead to a bunch of discoveries and then improvements in how I'm trying to clean up the species occurrence data. I say improvements, but let's quantify that a little in a moment after I say what I did.
Firstly, I'm mapping species occurrences to IUCN Redlist habitat classes, and thus far I've been treating a species' habitat preferences the same, but the red list does actually classify some of them as "suitable" and some as "marginal" and I could see a few instances where the marginal values were the cause of a lot of our urban creep: many species have urban as marginal. So I removed the marginal preferences for training, but kept them for validation as in theory they can be there, but statistically I don't think we should use them as signals for training the map.
Next up I realised some of the assumptions I'd made early on with the OSM filtering of habitats was naive or embarrassingly UK biased. For instance, for some reason I'd decided parks meant urban or wetland - not sure why I did that, as it's clearly wrong, but this also meant we got urban pixels in places we shouldn't in the UK countryside with country parks for instance. I fixed that to accept to be more broad in terms of natural habitats, but I found an interesting challenge with trees. Many parks have forests parked in them, in which case the trees do tend to just be in those areas, and so I don't want to have occurrences in the rest of the park map to forest, but in the park in the opening example (and in quite a few others) there are no trees marked, and so we need to let forest be a potential target. Obviously parks make up a very small percentage of land, but because of how citizen science species data is biased it's kinda important to get parks right.
I also spotted whilst doing this why I had so much wetlands in marine areas, because in OSM terms there are no oceans. OSM does define a coastline, but not what is either side of it as a polygon. So I had to explicitly code that. But then I still got wetland species on coastal beaches because the coastline runs through them often and the more popular side with observers is on the dry land side, so then I need to include polygons that cross the coastline as being coastal not inland...
Basically, it's just fiddly. We're dealing with two attempts to quantify the world (the IUCN Redlist habitat classes and the OSM land cover ontology) that are relatively limited in nuance (where as habitats are infinitely nuanced) and then applied by the people who create the labellings we have to work from in an inconsistent fashion because. To be clear, it's not that these people are doing a poor job, quite the opposite: it's that it's really hard to get right all the time when you have a fixed set of quantisations on what is very fuzzy data and sometimes one person will make the call at these edges slightly differently from another one and both can be equally justified.
This is why I'm excited by the work Shane Weisz has been doing in creating assistant tools for Redlist assessors. You clearly (at least it's clear to me) don't want AI's to make these decision, it does require a human expert to make the call, but I do think having a tool that can make it easier to discover what others have done, suggest overlooked subtleties and so forth, is really useful. The problem though is how do you train it without the mistakes of the past informing it? I can see empirically where (to my mind) IUCN habitat classes now are used to signify something that doesn't match the original formal description, as the assessor community has clearly chosen another interpretation of that habitat class that how it was originally posed. But what is right: what the community decided without actually ever talking about it or the original standard? This is also why I'm glad Shane is researching this rather than it being a tool already in use: there's some hard questions to answer in this space and doing the wrong thing could make things quickly worse rather than better.
Oh, and the validation scores after all this? They're mostly the same, but the maps visually are better. This is interesting to me as I'm using the same validation technique as most previous work :) What I do see is the map is better, so I've been trying to find other scores to help me assess map quality. A big one is comparing regional habitat totals to other summary data out there, like that from the office of national statistics for the UK or Mapbiomass for Brazil. Unfortunately this is hard because some places will class land as say pasture, and others will class it as grassland/shrubland. Anyway, I've not quite done on the input improvements, I have a cunning plan as they say, but more on that next week.
LIFE
I mentioned recently we lost a disk on one of our servers, and it turns out we lost some intermediary results on the most recent run of the LIFE pipeline. All the final results were safe from my last run, but several researchers wanted to access the partial results to save them having to build them from scratch individually (and not just in terms of running it, but also finding compute, learning how to set it up, etc.). So it was time to re-run the pipeline yet again.
Thankfully I put in a bunch of effort from the last run to make sure it all runs via snakemake and so is fairly easy to run, with the exception that it can no longer fetch the HYDE dataset automatically as the University of Utrecht block all non-human downloads now in response to AI scrapers. Unfortunately this makes automating data-science pipelines impossible without entering a security arms race (been there, done that, don't wish to do it again). I totally appreciate that their sys-admins probably didn't intend for this fallout: my use case is just collateral damage in the attempt to stop their networks being hammered constantly, but it is funny that this open, public, creative commons licensed data can not be downloaded automatically any more for the purpose it was created for. I take a strong stance against human downloads in data-science pipelines because it's an opportunity for error: people think they have version x, but they have version y, etc. If we automate this we can check hashes, use versioned APIs etc. and prevent that kind of mistake. The stance forced upon the University of Utrecht and others unfortunately undoes that and introduces another point of error into an already complex pipeline.
Beyond downloading it, I also switched to running things in Docker this time, as I slowly try to be more rigorous about using containers to run my work in order to make it easier to record what the environment I used was.
30 day map challenge
As mentioned last week, I'm having a little fun taking part in 30 day map challenge. For the most part my intent is to use this to build up a little map rendering library on my own to use with a side-project I have planned, but I've also mixed in some other bits from my work where the prompts did align. I also skipped one day I didn't feel inspired by - I highlight this as I know a few people are put off by these challenges as they feel they need to be completist and worry about other commitments in their already busy days. My rule is do it when it's fun/interesting and you have time, otherwise skip it. Each day you do you probably learn something or flex a mental muscle, so it's worth trying in my mind even if you just do a few.
Day 2: Lines
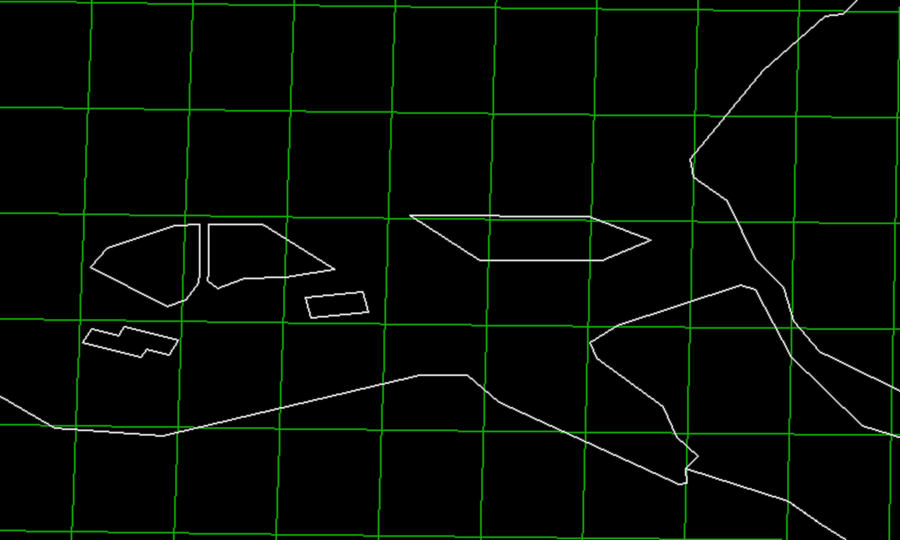
Nothing too fancy here, just plotting some GeoJSON data for simplified UK borders and OSM data of the nearby windfarms using the OCaml code from day 1.
Day 3: Polygons
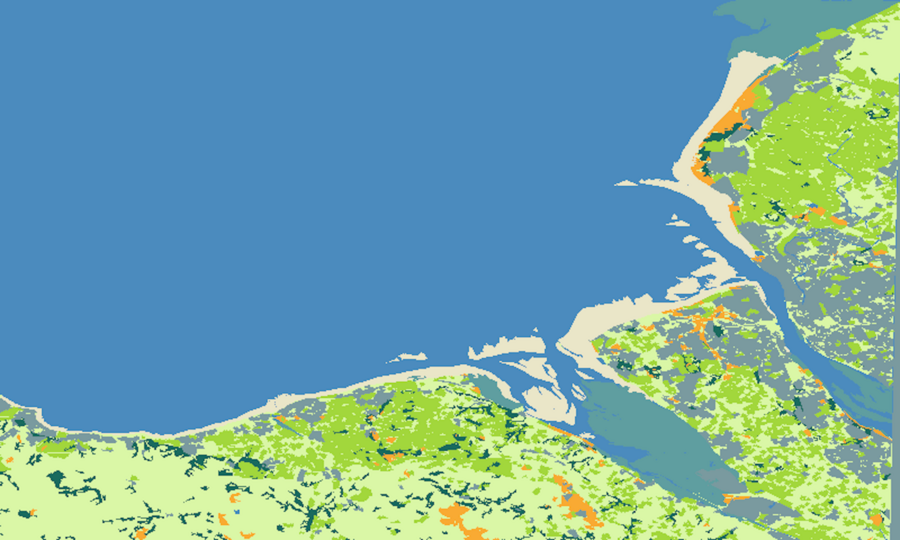
I like this one as it's effectively the same code as day 2, which looked like it was drawn in the 1970s, but just by taking finer detailed polygons from #openstreetmap and colouring them in you suddenly get this vast sense of place for now actual improvement in technical finesse.
Day 4: Clusters
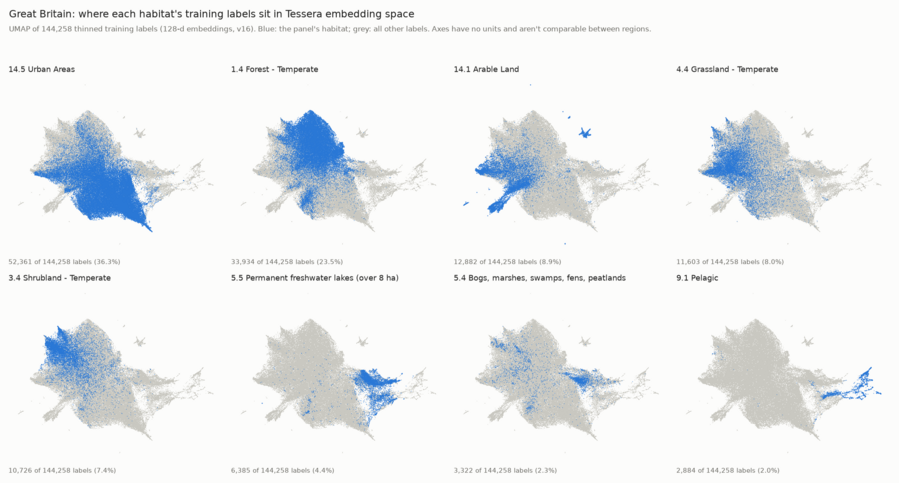
It happened to be I learned about a new technique at work this day that is about clustering data, which I'm using in making habitat maps with machine learning models.
What you can see in the attached image is a umap that is showing how well my different labels are clustered within the embedding space of the machine learning model. Each point in the cloud is a pixel in the UK where I've labelled the habitat, and then the structure is how close the pixels are in the Tessera machine learning model. You'd hope that for a given label you have all the similar pixels with a similar label, and so they'd naturally cluster together.
Unfortunately for me you can see that "urban" is a problem, as it appears everywhere. This is down to two challenges with trying to build habitat maps from citizen science data: 1. urban looks like rocks (building), grasslands (parts and gardens), farm fields (hedges splitting areas of grass), etc. and 2. citizen science data is typically very much biassed to where people are. These umaps let me quantify this problem so I can measure the impact of any attempt to filter the data to correct the bias.
Day 5: Sight
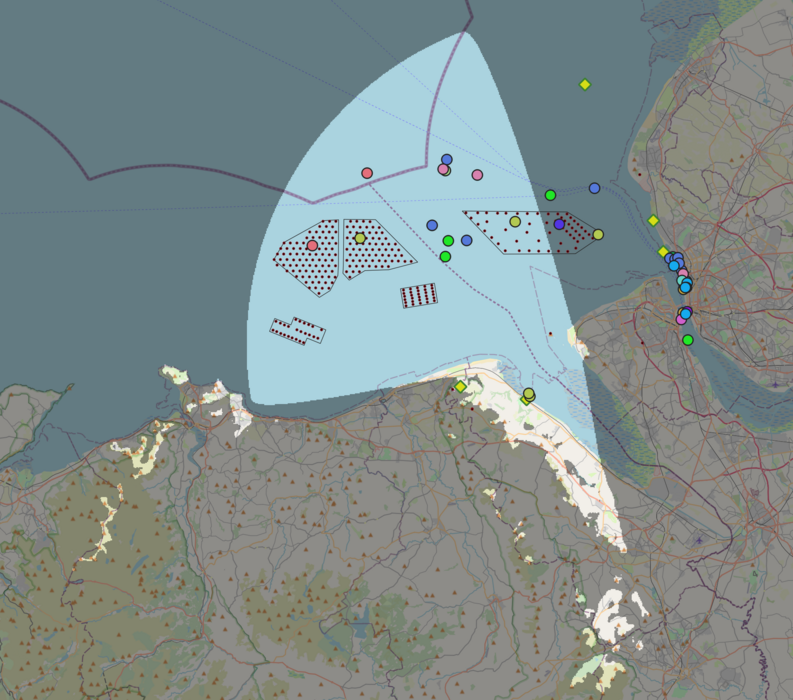
This shows the viewshed (aka line of sight) from where I live roughly. You can make using [GDAL's][gdal] built in gdal_viewshed command line tool provided you have a digital elevation map to hand.
What's interesting to me then is that AIS (the ship location radio system) is meant to be line of sight based, but despite there being a ridge line between where I live by the water and the river mersey I can still get AIS signals from the larger boats at Liverpool Docks and Birkenhead - an unexpected bonus from our antenna in West Kirby! I don't get small boats on the Mersey, alas no mersey ferry, so it's definitely a weak signal from over there, but it's enough to see the Stenna Line large ferries coming from Ireland.
It also shows how tall Yr Wyddfa is that we can see the tip of it on a clear day despite being 70 odd kilometers away and having other hills in the way.
Day 7: 10 minute map
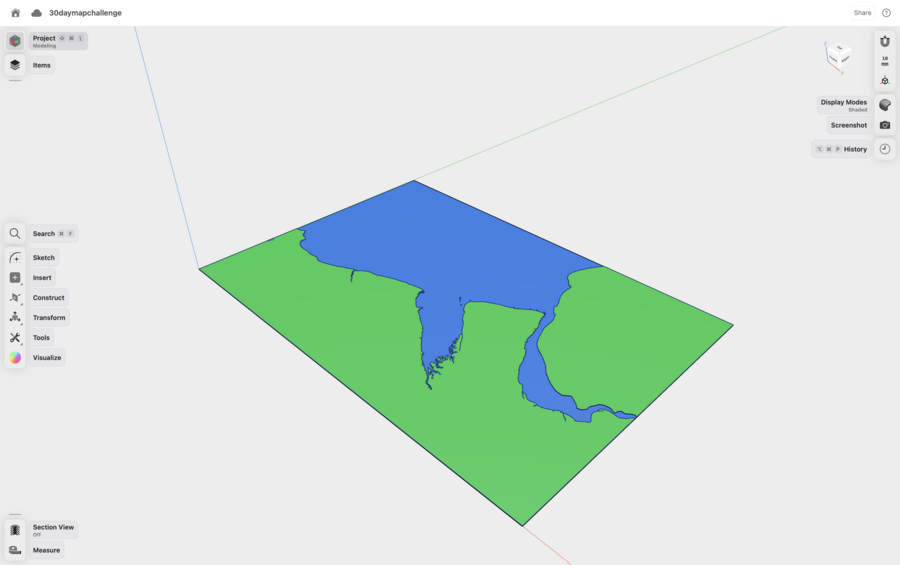
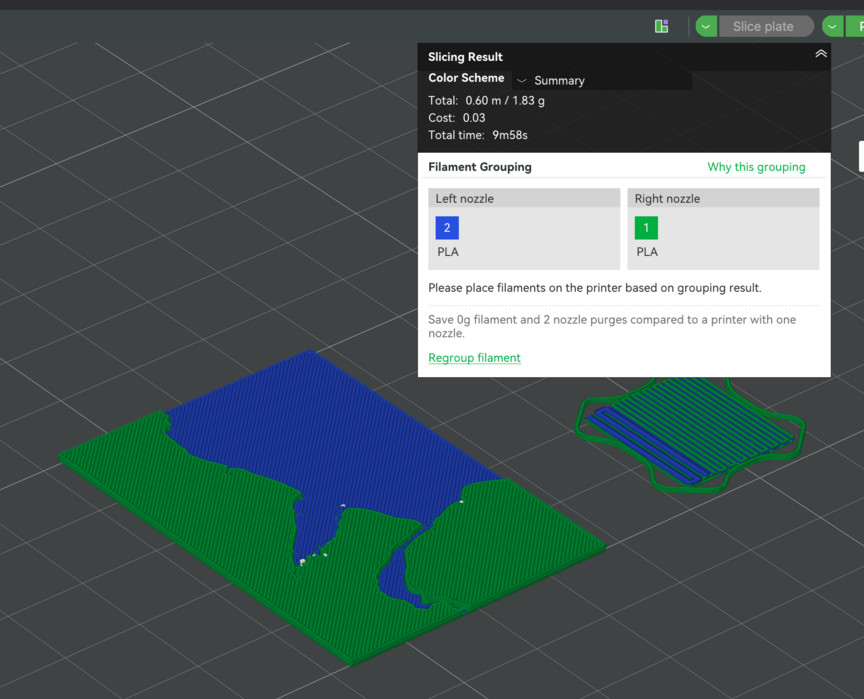
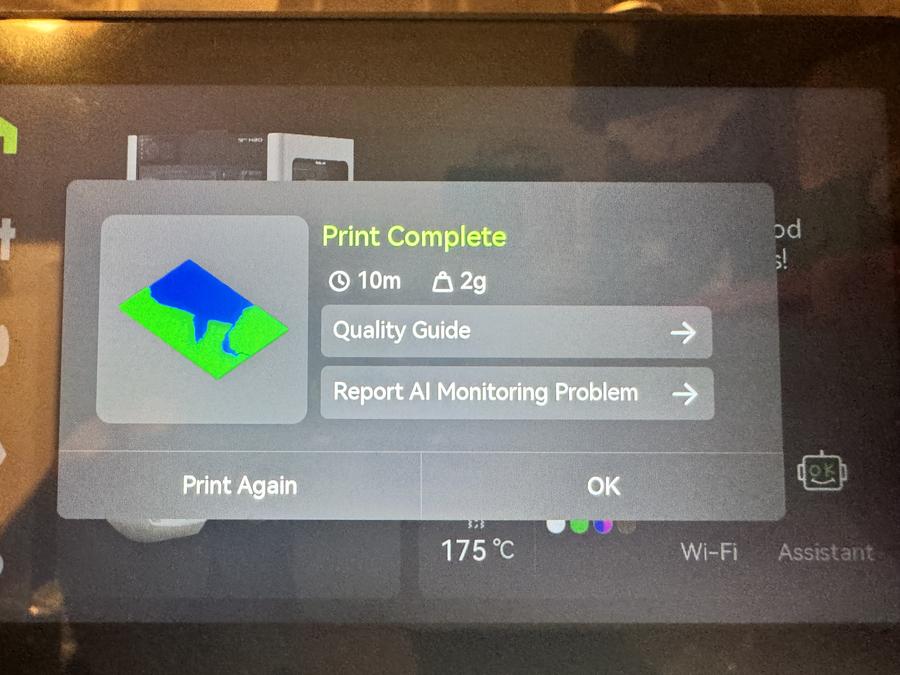
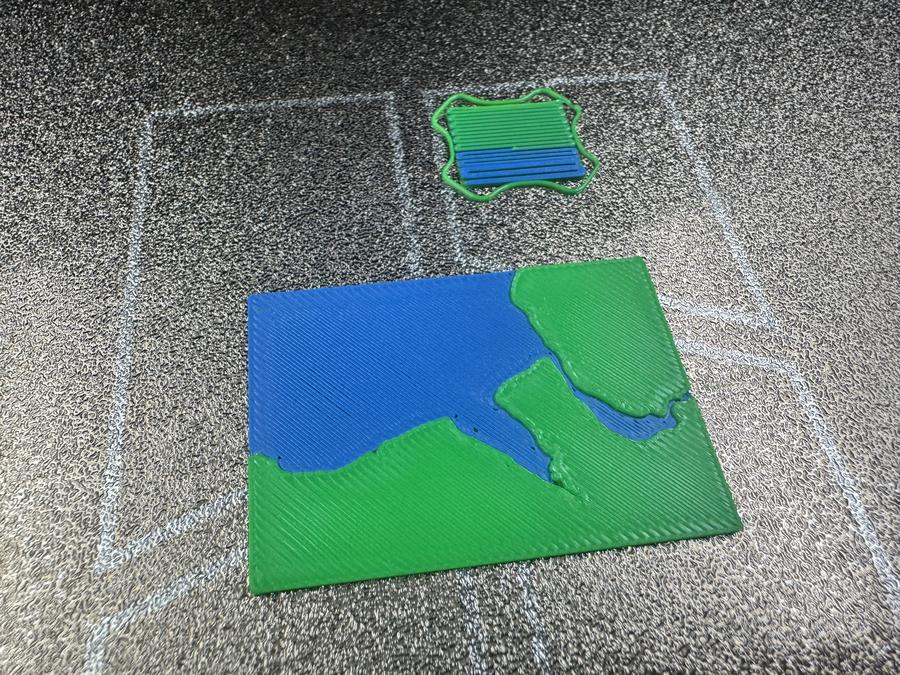
I twisted the "You have no more than 10 minutes to complete this map." meaning slightly... instead of 10 minutes for me to make (though it can't have taken me that much longer than this) I went with ten minutes for a 3D-printer to complete this map :) Not the best print quality obviously, but I only had ten minutes in which to print it.
Day 8: Utopia
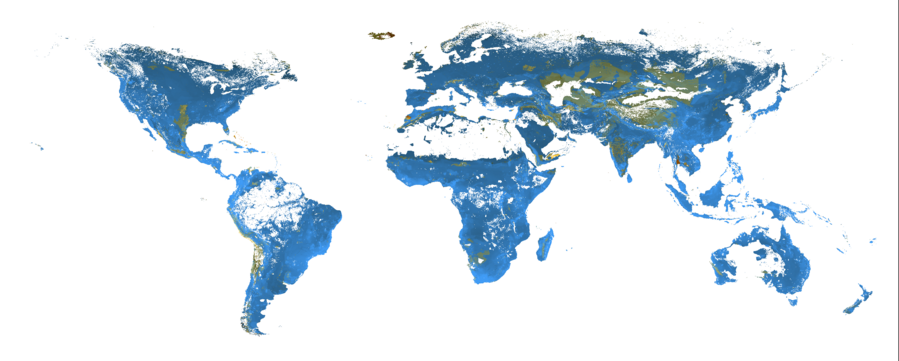
The day 8 prompt was "utopia", for which I wanted to map the bike lanes in the Netherlands, but turns out someone has already had the same idea and done that in a previous year (not necessarily under this prompt, but still).
Instead I made this variation on of the maps from the LIFE biodiversity metric paper I helped on a few years ago, which shows the impact on extinction risk if you restore land to it's presumed natural state. More blue the better, more orange worse. In hindsight it's obvious that rewilding will have a negative impact on some species that have flourished in anthropogenic habitats, but I think that's probably broadly true, and I always think of this as one of the science communication problems we face when trying to improve things broadly.
Anil asked me what about this was utopia, to which I responded that I guess this is my way of saying I don't believe in utopia rather that we require compromise. Anil sent me this link on how Star Trek isn't utopia which I still need to read, but it's been something on my mind of late, particularly with the passing of Patrick Stewart, who was my generation's captain. The ideals presented in ST:TNG has shaped my thinking of the place of technology in society and where society was headed, but I suspect in the 90s it felt like a forgone conclusion, despite the script writers explicitly telling us it wasn't:
This week
- I'm in Cambridge for the first few days, so looking forward to catching up with colleagues and having interesting discussions.
- Confirm my LIFE run has generated the thing I think it should before I pass on the intermediary results to others
- I have one major change I want to make to how I refine the input data on the habitat map work that I hope will shift the needle somewhat by stopping the spread of urban data as I refine things.
Tags: weeknotes, 30daymapchallenge