Weeknotes: Rendering 156 km^2 of Swedish forest in Minecraft
Apr 18, 2026
A question I've been asking myself a lot since I started doing geospatial climate analysis is how do we communicate the results to non-domain experts? I spend a large portion of my working time building up maps that show the impact of different threats on biodiversity, both with the IUCN's STAR metric which looks at a general view of threats to identify at risk hotspots on the globe and our LIFE metric, which specifically looks at the impact on extinction risk of land use change), but these maps I make only really make sense to other climate scientists who already know what they're looking for. But we have a problem then that the risks of say deforestation or hunting, or the benefits of rewilding, are lost on the people who we need to get engaged so that politicians feel the pressure to do something. And it's our fault, as we typically only communicate to each other.
Last summer I had fun working with summer student Finley Stirk where we did some playing around with 3D-printing landscapes, as one possible way to take these datasets and start to make them more tangible. I've not had time to push that one further yet, as I realised that although colour printing is much easier than it was, doing the detailed level of colour changes we need for the kind of maps I make didn't quite work out yet. But I still want to do more on that.
However, another approach has been cooking away for the last few months, inspired by SVT's Great Moose Migration. For the last five or so years myself and many other people around the world have tuned in to watch a remote part of a Swedish forest with a river bend in it, as it is televised for several weeks. Each spring the moose in Sweden migrate north as the ice melts and the snow clears, and this river bend is one where they happen to frequently swim over the river. It's a landscape I know well in detail from countless hours watching it on the screen, but I've never been there, and I have questions, like why do the moose swim in one area and not in another? How far is the river to cross really? SVT use excellent zoom lenses to track the moose, but a zoom lens compresses all distances so they feel the same.
At the same time, following on from my 3D-printed work, and pondering some of the work lead by Alison Eyres, where she tried to relate the global LIFE metric down to specific local interventions on the ground. I wondered how do you communicate the before and after of say a forest loss event or a rewilding? You kinda want to be there to understand it, but we can't ship everyone to Madagascar for the day.
In theory, this would be a great use of virtual reality, something Anil and I chatted about back when Apple released their Vision Pro headset, but very few people have access to such tools. But lots and lots of people regularly access realistic virtual locations in video games. Now, I'm not the first to think of this, nor the first to try it, but I was interested in what could I do if I took the usual tools I have at my disposal, or the methods used by the smart folk I get to work with, and tried using those to generate a map in Minecraft?
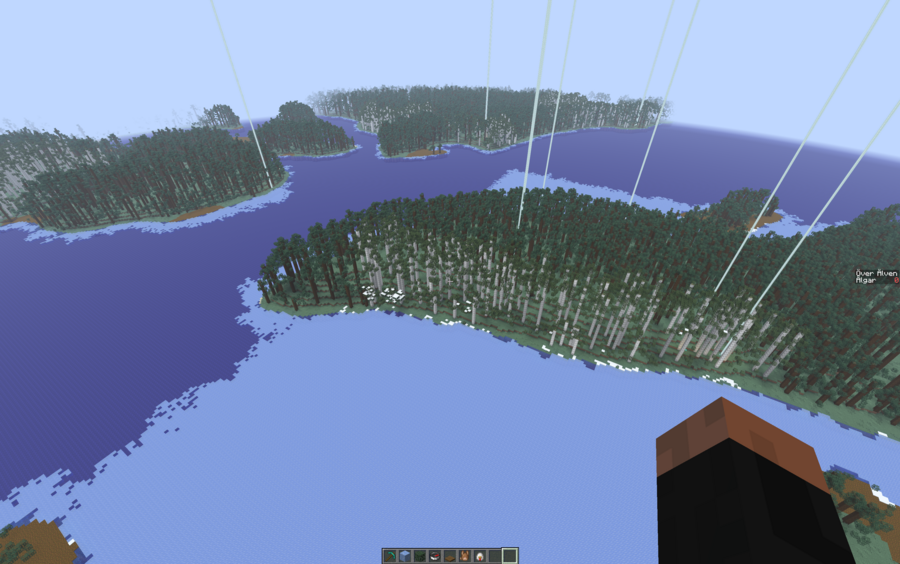
What you're seeing here is not a randomly generated Minecraft world, but one that is meticulously recreated based on the real data for land contours, tree heights and locations, and even tree types.
At first glance, this might seem less good than the Lidar version I made: you can see a lot less detail in Minecraft block form certainly. But as someone who has played Minecraft I found I immediately connected with the landscape in a more immersive and immediate fashion. Suddenly the distances I mentioned before became very apparent: of course the moose would rather swim at this point, as it's so much closer than the other points on the island. And the why does it take the moose so long to get from Passagen to Naset, which seemed a short distance on TV, well, when you have to walk it even in a virtual world you start to appreciate actually it's a lot further than you assume.
Building this map was interest: it's all built on open data from a mixture of places: Swedish government data from Lantmäteriet for the elevation data, the lidar data, and building data (all different datasets I used to build the map), the Nationella Marktäckedata land cover map to tell me what each are was, and then Open Street Map to get roads. No single dataset was quite what I needed, but as I've documented in past weeknotes (here, here, here, and here) I was able to use the different datasets to let me refine each other: the land cover map is at 10m, which would have made for crude water edges, but I could use the Lidar data to refine that down to 1m as required for minecraft.
I also used actual geospatial data-science techniques from work to build this: the aforementioned Dasymetric Mapping to enhance one data layer with another, and using the lidR R package to let me work out where the trees are. I'll do a follow on post shortly to explain the how in more detail.
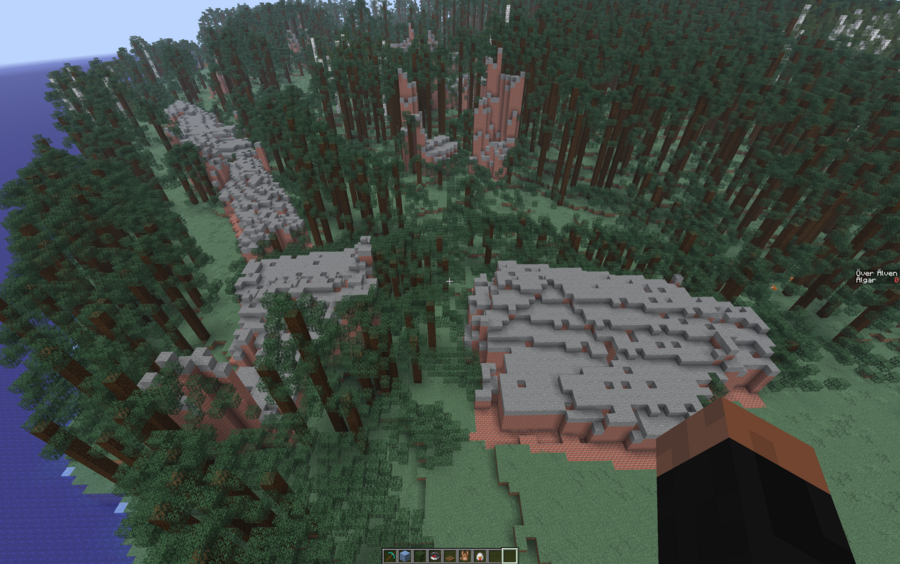
To me it was fascinating just exploring these virtual worlds and seeing what was in the data. And it's not all good: trying to use the Lidar data to get buildings did not work well for instance, as you have spotty coverage, and things like trees overlapping buildings, etc. But I think that's a key part of this also: I want people to see the limitations of the data. It's amazing that we can recreate the world like this so readily, but the artificial breakdown of every 10m square into a single land cover type is going to be wrong in places. People I feel need to understand where this data works and where it doesn't, so they know how much trust to put in people who claim to know everything from just a data file vs having people on the ground.
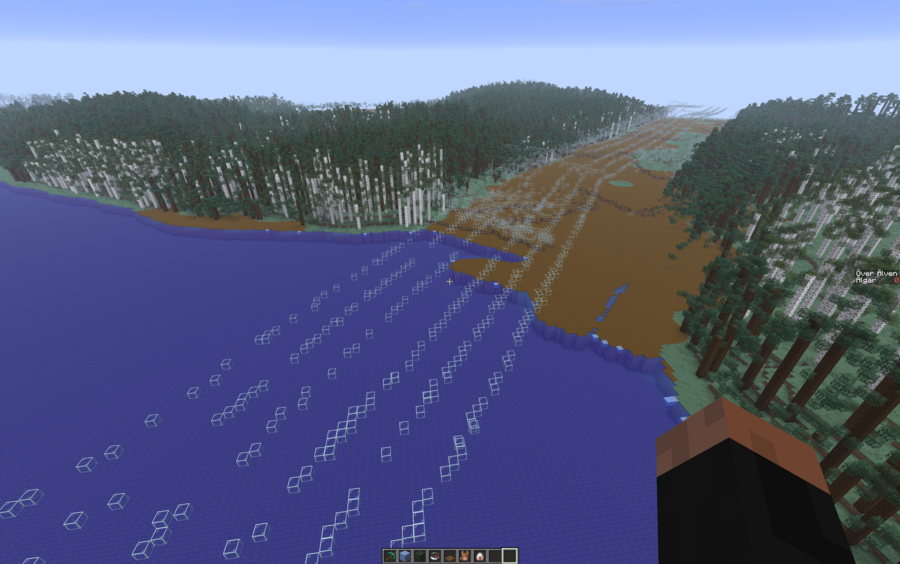
On the flip side I'm still amazed that the power lines stand out so readily in the data:
In total I've rendered a 12.5km x 12.5km area around Kullberg, where The Great Moose Migration is filmed, and I've looked at a tiny fraction of it to see what's out there in the data.
We'll see what other people think of it: The Great Moose Migration has started early, so I had to rush a little to finish this in time to share with the community of watchers, so they can also experience a virtual first hand of what it's like to be in the same place as the moose. But longer term I'd like to do evolving maps to communicate data around climate and land use activities. Imagine you recreate a bit of a tropical forest, let people have some fun in there, build some things, get a sense of the place, and then you start to play forward actual deforestation data. Would that help communicate the impact it has? Or you could do the inverse, and show a desolate area become habitable again as part of an intervention. Or here's what would happen to the forest if we didn't support the local farmers.
This view doesn't work at a global scale, but I think as a way of communicating local impact in a quick and inexpensive way, might have some merit. Particularly as many young people already know Minecraft so well, so it's already a place they have familiarity of and understand the interaction vocabulary.
If you have a Minecraft account and would like to explore the world, drop me a message and I'll invite you to the server. For now it's just on my own private server that probably can't handle too many people - if it proves actually popular I'll have to try fix that!