Weeknotes: Geocaml Hacking
May 22, 2026
A couple of weeks ago I wrote about building a point cloud visualisation tool in OCaml, and I've found a little time this week to crunch of that more, mostly by contributing to the various existing geospatial libraries that Patric Ferris has started pulling together under Geocaml. For example, by adding a simple bounds check to the rtree library there, I've managed to make my visualiser work out the spatial extent of the tiles being served to it, and so now it's no longer hard coded to a specific location in central Sweden, and I can for instance throw a bunch of data collected for one of David Coomes' projects of the Cairngorms up in Scotland:
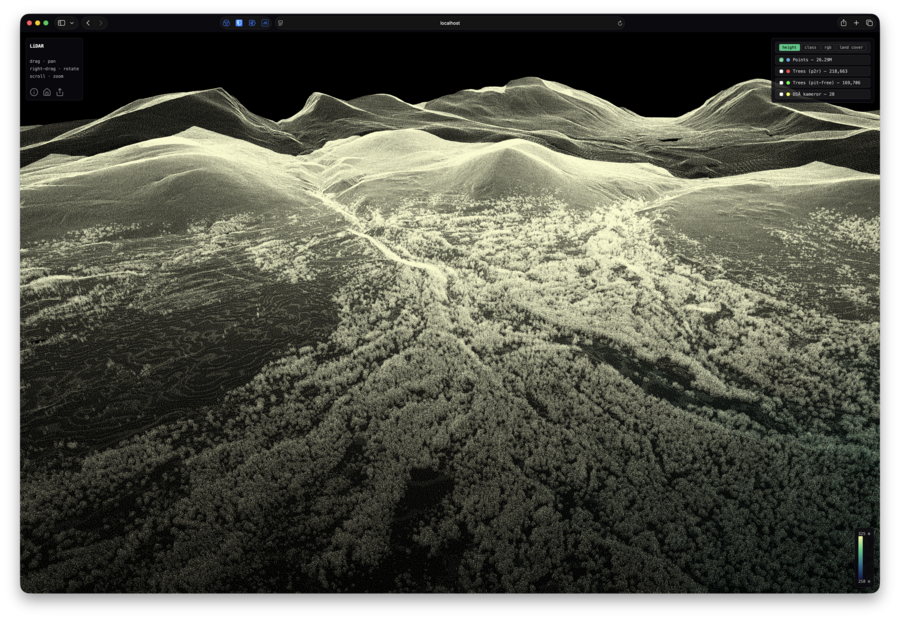
I threw in all 114GB of data from that project into my viewer and the server coped fine with 635 tiles. Which shouldn't be too much of a surprise, as the viewer is only ever fetching 25 tiles at once, and even for an optimised rtree index 635 tiles doesn't feel that much of a stretch, but it's an order of magnitude more data than I've pushed through the viewer before, so that's a win.
On the topic of orders of magnitude: the one thing that did catch me out about the Cairngorms dataset is that the data density in these point cloud tiles is an order of magnitude higher than the national surveys I'm used to, which are just a few points per square metre. Here we've got so many points that my viewer just whites out in places because of the naive zoom density algorithm I'm currently using. This also means the browser is throwing around 70 million points at times, which is fine on a top end Mac Studio that I use for my number crunching, but needs to be corrected before I find somewhere to host it publicly as it'll make smaller devices and network connections complain.
For context, here's how much of Scotland we're covering:
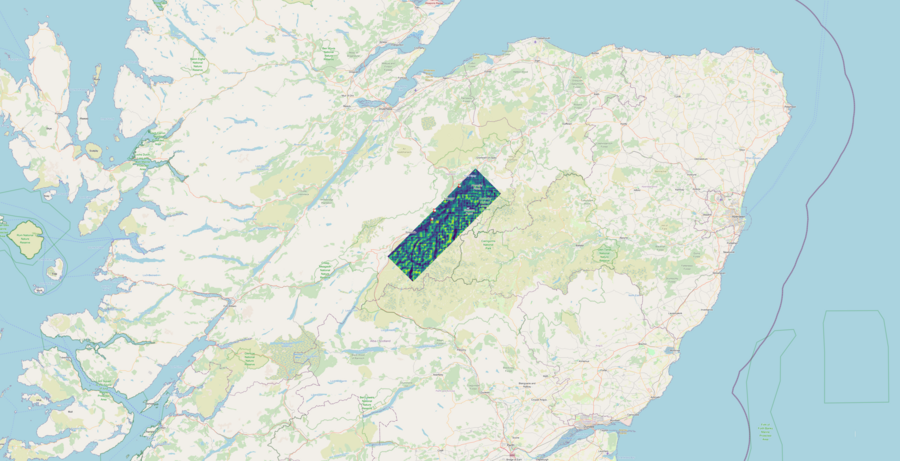
It's not much, but as I say, a significant step up for this little project. I have also downloaded a significant chunk of Sweden's Höga Kusten region too, but for now it's good to be able to explore my homeland a little. I've never actually visited the Cairngorm's National Park, probably Glenshee was the closest I've ever been; I grew up near Glasgow so I'm more familiar with the west coast. I guess I now need to fix that, for testing purposes of course :)
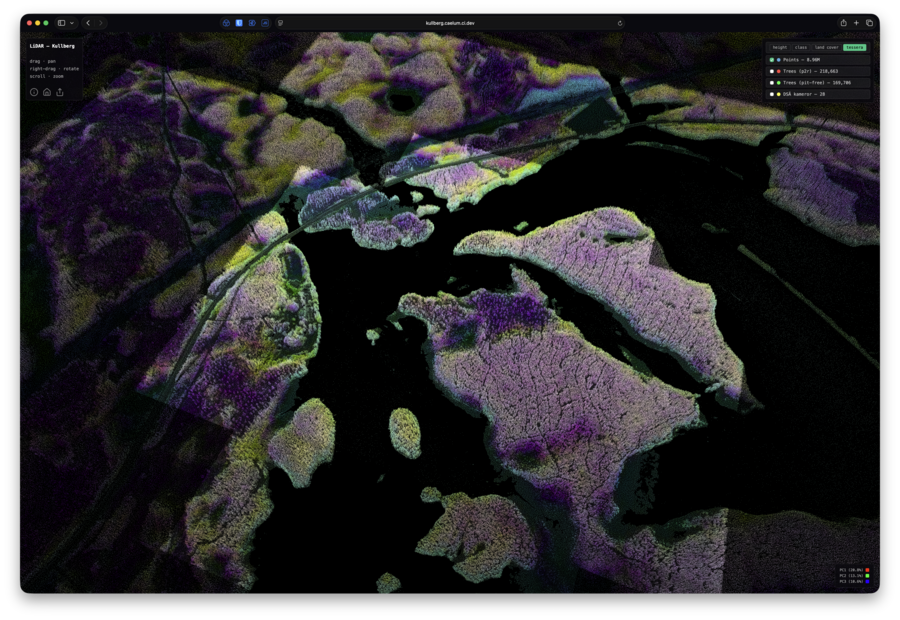
The next thing I wanted to fix is to start making the viewer map-projection aware. If you're not familiar with map-projections then I cover it in more details in this post. Both the Swedish data I was using previously and the Scottish data I'm playing with here, and the other UK tiles I've downloaded previously from the UK Environment Agency are all in the respective national map-projection, which means you can't display tiles from the same dataset together and have it make sense without doing some other processing first. Whilst this isn't really a problem, as it's unlikely I'd ever try displaying both datasets on screen at the same time, I will be trying to mix in other datasets such as land cover maps, and the Tessera false colour layers, such as I did here as a quick add on to the stand alone viewer for Kullberg.
I have a sprawling weeknote in the works on what Tessera is and what I plan to use it for, so I'll avoid getting distracted by that here; the point is that this viewer is intended to use Lidar data as the basis for looking at other datasets, and those datasets might be in other projection systems: e.g., open street map data is stored in lat/lng format rather than meters from offset used in the various national projections. Lidar datasets do typically have metadata describing the projection system used, stored in Well Known Text (WKT) format, so a start is processing that and using it to at least check that all my lidar data tiles are using a consistent projection when loaded.
In geospatial software you'll find that underpinning many popular packages are a few key libraries that everyone uses, and one of these is PROJ, a library for processing and converting coordinates between map projections. Again, Patrick had made a start on writing an OCaml wrapper for PROJ, but that focussed on doing point translation, rather than processing the Coordinate Reference Systems (CRS) from WKT. So I spent some time learning how the OCaml Ctypes worked, which is how Patrick had built the library, and expanding the functionality. In the end I did quite a lot of reworking of what Patrick had built, changing the API quite a bit, but in my defence I did leave it with unit tests, which it was missing before :) The main bit I feel bad about is Patrick also had it working with js_of_ocaml by having the same API also map to a PROJ Javascript library, and I have not bothered with that yet. So I'm currently making a bunch of work for Patrick, which perhaps means this will end up as a personal fork instead. But now that I have PROJ OCaml bindings that will process CRSs I can start on my plans to make my point cloud visualiser more projection aware.
All of which means I need to start getting a handle on the front end code for the visualiser, which has been thrown together quite messily so far as I pull together the proof of concept. It's not helped by the fact I dislike the Javascript developer ecosystem, which is seems to be built on the assumption you're building Facebook or big complex system, rather than just a single small webpage with some Javascript in it. Thus I'm aware I'm fighting against the tide by pulling in Javascript libraries manually rather than using something like npm, and unfortunately I might just need to concede defeat on this as I try to find better ways to pull in raster map data.
Currently the maps have been using a hack to load the colour data from map rasters. In the screenshot of the tessera colours above, or when loading the land cover maps, I've processed them by hand converting the GeoTIFF data to a normal RGB colour PNG image along with some metadata in a JSON file about the geospatial extent of the PNG. This pre-rendering hack worked fine for a small fixed area, but isn't going to scale up to what I'm loading here. Instead I want to move to a proper map tiled raster, and for that I'll move to using Zarr format given that's what we're using for other things in the group and I've started looking at using it for my other data-science pipelines. Anil Madhavapeddy recommended zarrita.js, so I'll have a look at that next as a way of pulling in the Tessera false colour data onto the Cairngorms map.
Tags: weeknotes, ocaml, lidar, point clouds