Weeknotes: 26th February 2024
Last week
LIFE investigation
I spent a bit of time trying to understand an issue that we found when Ben Balmford asked for a set of LIFE layers related to 117 UK bird species on the IUCN realist. Of the 117, it turned out only 65 we computed as part of the original LIFE map, meaning 52 species were unaccounted for. With Alison being on maternity leave I had a dig through the LIFE pipeline, and managed to account for two reasons the species didn’t appear:
- For 21 of the species we didn’t have suitable historic data to allow us to calculate change over time for the species.
- For 31 species they were rejected at the data ingress stage, because they have marine habitats as part of their habitat list, and LIFE currently doesn’t deal with marine wildlife.
For a simple answer it took me a day to track this down, as there are manage possible stages at which data could have been rejected, and a bunch of the code for ingress processing was not something I’d had to read through before, being written before I joined the project.
Still, in the end I did manage to process the data and get Ben results based on the remaining 65 species on his list. As part of this I ended up writing some more of the final processing in Python rather than R, as the R code had a bunch of hard-coded assumptions around it processing all species for the final result, and so now we have something that can work for smaller subsets of the LIFE metric, which is one of the features of LIFE as a metric, it’s meant to be composable.
Sysadmin
I managed to copy 42TB of data that's not being actively used but we'd like to hold on to from our primary NAS to a new home, which took the better part of three days: one forgets how slow spinning disks can be these days. I can now remove that data from the NAS and hopefully give us some breathing room, as we’ve been a little over 95% full for the last few weeks, which has been making me nervous.
Tropical Moist Forest Evaluation Methodology Implementation
I generated some more data on the stopping criteria, looking at the trends of statistical significance of results over multiple iterations.
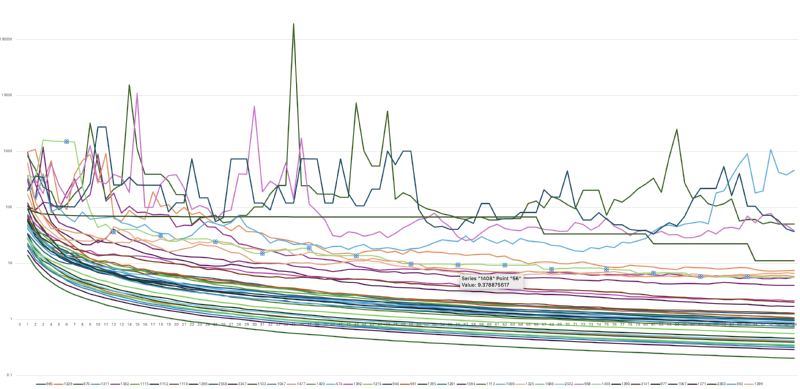
From this I infer the following three things:
- We can see some projects sail under the 5% significance line (1.0 on the graph, which has the axis ticks on it)
- We can see a bunch don’t quite make it, but my concern is that those curves are quite flat, and so it’ll take an awful lot of iterations for that to actually reach the stopping criteria.
- There’s some projects which are just all over the place, at times diverging from the expected level of significance.
From the TMF meeting last week I was tasked with two things:
- Get Tom a list of the projects that are in set 3
- Try running with a smaller sample of M set for one project and seeing how that impacts the number of iterations for stopping.
In other TMF things I sat down with E-Ping and got him up and running using the TMF pipeline on Sherwood, and he was able to successfully get the additionally data for our standard test project. This means we now have two people outside the authors using the code, which feels like a good step forward.
I created a channel on our group slack for users of the TMF pipeline to ask questions about running it, that seems to be a useful resource.
This week
- Try setting up a database to store IUCN Redlist data in, now that I’ve downloaded the raw data
- Generate the above TMF data for Tom
- Chat more to E-Ping about the TMF pipeline
- Write up Vanilla OS learning
- Work out how to do a run of the AoH data for Simon
- Write an EMFCamp talk abstract with Patrick