Weeknotes: 10th August 2026
Last Week
Tessera Habitat Mapping
I'm continuing to push forward mostly on the habitat mapping work, with occasional side quests into tooling bits I need to support that (changes to Yirgacheffe and Geotessera, more on that below). It's starting to take shape, in that the maps I'm making have some recognisable features, but I'm still at the phase where I'm learning about the data and having to question initial assumptions: the maps are in that awkward phase where they look good at first glance but are questionable when you dig in.
For instance, here's a view on Anglesey, over on the north east of Wales:
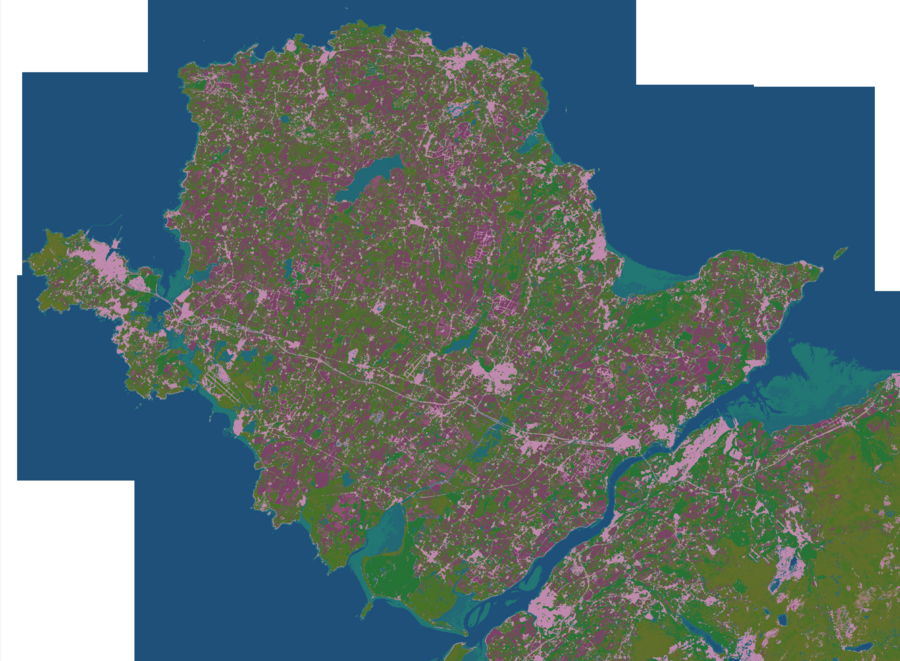
You can see a good mix of urban (light pink), arable land (dark pink), shrubland, and forest. It picks out the Newborough Forest with it's tall pine trees, and even the race track on the island. However, it misclassifies Mynydd Parys, an old copper mine that you can explore, as urban rather than rocky - a common mistake if I look around mountain ranges otherwhere. Still, good progress since last week.
Rather than talk about the map, I thought I'd share some of the process of how I'm building the pipeline to build the map. This is in part motivated by discussion in the Nordic-RSE Zulip, and in part as I've been trying something new, which has worked well for me so I want to record that. The context here is that I have an idea how we can improve on the habitat maps we use for the other pipelines I've worked on, and so I'm implementing this, aided by colleagues how have more experience on both general ecology and in building habitat maps for other domains. The focus is how can I quickly prove that this idea has legs or not, and now can I keep track of that, and keep my collaborators informed, both of whom are remote (including remote to each other).
The coding
Whilst in general I write all of my production code myself, for this project I've used Claude Code to help build a prototype pipeline quickly, but done so in a way that the output mimics my own code and overall architecture so that I can keep a mental model of what the code is going. For me I'm not trying to replace writing code as much as just doing it faster so I can more quickly work out if this project is going to succeed or fail at a science methodological level. The challenge with any abdication of code writing though is keeping a mental model of what's going on so that when the code doesn't do what you expect you can dig in to understand why: is it a bug in the code? is it the data didn't conform to expectations? is it the scientific method is flawed and the approach needs rethinking? To be able to ask and answer those questions I need to always have a working model of the overall pipeline structure in my head. I feel I've achieved this through a couple of practices in this project, most of which I apply to my own code writing anyway.
The first is that my data-science pipelines follow the tried and testing UNIX philosophy of many small pieces loosely coupled with queryable results at each stage. Each Python script in the pipeline typically will only do one transform within the pipeline: one to fetch data from repository, one to filter the data as we need for this experiment, another to combine the filtered data with some other source, etc. These small scripts then join together, Voltron style, to form the larger pipeline. As mentioned, I do this anyway when writing pipelines by hand, as I think it's a key part of keeping scientific pipelines flexible: the very nature of science is to question and challenge and try other ideas, so by having a pipeline made of lots of small parts it's easier to swap one stage for another, and if my ecology colleagues want to understand just one bit of the pipeline so they can play around, then similarly keeping each script small hopefully makes it more accessible.
So whilst smaller scripts is a good start to maintaining accessibility to the code, I need to be able to quickly read through the code and understand it. So the second trick has been establishing a baseline for code style and structure. I remember many years ago I had to read a bunch of low level code within WebKit, the browser backend behind Apple's Safari browser, and I was amazed at how easy to read it was given I was coming in cold, it was written in a language I haven't used that heavily, and it was quite gnarly code in places. This was made possible as WebKit (at least back then) had quite a well adhered to set of coding guidelines. That experience has shaped how I write my code for the data-science pipelines I write, as I hope that others will be able to take them and work with them after I move on to other projects.
How does that work with Claude Code? Well, like with many projects, there are aspects of this project that are quite similar to projects I've written in the past: I'll need to get some data from the IUCN Red List and some species occurrence data from GBIF, etc. And so I seeded the project with those scripts and asked Claude Code to modify them keeping within the existing code style. I then asked it for new scripts to follow the layout I have, which is quite boiler plate heavy: PEP8 import order, using argparse for all inputs, doing that in a main function before calling the actual "science logic" in another function (which means pipeline parts can be combined in a library by others, which I've seen people do), it all has type hinting, and must pass automatic format and typing checks. Because of this guidance I find the code generated by Claude Code easier to quickly read and edit than if it was just implementing it using whatever style was the default behaviour.
Thirdly, I take a very iterative approach to building the pipeline out. So for each update of the pipeline I change one or two things, ensure those work as I'd wanted, run the data, assess the impact, write up the status (more on this later) and then move on. So I use Claude Code to nudge forward at each stage, one step at a time, meaning again I understand what has changed as I go.
And finally, I do go and edit the code when I think it's either quicker for me to do so than convert my intent into a prompt for Claude Code, or I just want to understand this particular bit in detail. I'll even write or rewrite whole sections to test and idea, see that it has legs, and then use Claude Code to do the more tedious house keeping around it. This way I'm still involved and so my mental model is kept up to date.
This approach has meant I'm moving faster than if I'd written everything by hand and was keeping it to a high quality bar readability wise, but slower I guess than if I was more hands off - but for me the key is maintaining my own mental model of what the pipeline is doing at all times.
Orchestration
The pipeline is glued together with Snakemake. I don't particularly like Snakemake, but I don't have a better alternative, and it is at least generally popular in the data-science community. I do this because some glue is needed to take all these scripts I've generated and run the end-to-end experiment, particularly for my ecologist colleagues who, although they may understand the overal scientific method the pipeline implements, they don't have the same detailed mental model of the implementation as I do.
This glue often lags behind code in the rush to test new ideas, particularly if one doesn't like the glue tooling, but in this case I use Claude Code to generate it (and have it formatted using standard tooling for readability), and importantly I have Claude use the Snakemake script to execute the pipeline. This way I can ensure that at all times the code and the glue logic are in sync.
Repeated evaluation
Having built a couple of large data-science pipelines for ecologists I've learned that I need to be very meticulous in recording intermediary results so I can explain to said scientists what decisions are being made within the pipeline, not just provide them with the final result. They, understandably, want to not just see the answer, but when something doesn't match their expectations they want to know why without having to come to me.
A technique that sounds perhaps excessive at first but has proven useful time and time again is to have each of the scripts generate a spreadsheet alongside whatever data artefact it would normally create - something I learned from Chess Ridley when working with her to build my implementation of her STAR pipeline. In each spreadsheet will be both a set of summary statistics and a record of any filtering decisions. For example, in the STAR pipeline that Chess wrote she generated a spreadsheet that had a row every possible species that could be considered, and then a column for each filtering decision (is it extinct already, does it have any range data, etc.), so you could see how far a given species made it before it fell out. It's a lot of data, but when you have two runs of the pipeline and one isn't doing what you expect, you can immediatly review these spreadsheets to spot where the data differs before you start looking at the code, and it sped up debugging my implementation of Chess's STAR pipeline so much faster. Since then other projects I've worked on do this, and again the ecologists now ask for that spreadsheet before asking me about the code, which is a win for all involved.
For this pipeline I've turned this telemetry up to eleven, not just doing it where I think it might be useful, but I make it a default for every script. This way I can readily compare the impact of any change we make to the pipeline, and I can do that at the point of the change, not just in the final aggregated result. Useful for when Anil asked me why adding marine species had helped with habitat classification in the Cairngorms: I have an audit that shows we added this many species, and more coastal species like rocky places, and so the rocks within the Cairngorms had more data to match. Even just seeing the overall impact of habitat changes from that change was easier to explain than looking at the final raster:
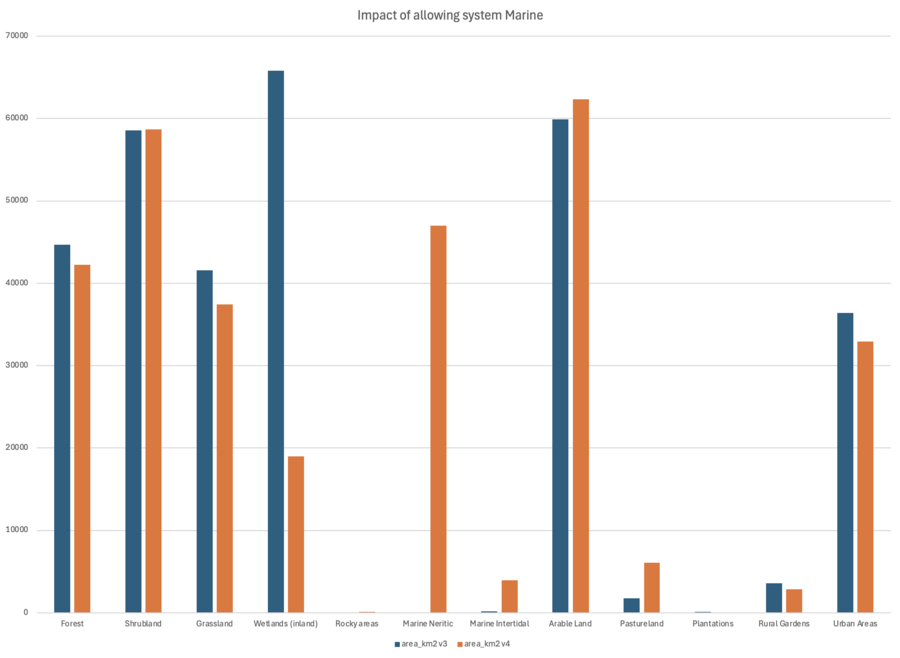
The other benefit of this telemetry, which I'd not originally considered when I started this, is that because I used Claude Code to add code to generate them, it is aware they exist, and without prompting now when I use Claude Code to do a run of the pipeline after a change it will compare the spreadsheets between the runs and highlight significant changes in any trends.
Communicating progress
As I mentioned before, my colleagues on this project are remote, and whilst we have a chat channel we can use to discuss things, I wanted a way to ensure that every decision I make is recorded somewhere so they can keep on top of what I have and haven't done. I'm acutely aware I'm a computer scientist working on ecology things, and so there's lots I don't know: by making my process transparent I hope to head off getting too far down a wrong path.
To solve this, at least for my side, I actually took inspiration from taking the minutes for the DoES commuinity meeting. For each iteration I write a short set of "minutes", using a todo list to review action items, and having sections for important points I want others to know. These all go into a single PROGRESS.md in the code, and so the latest code matches the progress report. For each pipeline iteration I have the following sections:
- Approach: A sentence or two about what I changed methodologically from the previous run, with perhaps a note about the expected impact.
- Inputs: Layout out where the data is coming from, in particular if I've added or removed data since the last run.
- Results: Here I discuss what has changed, using the data from the spreadsheets I generated to outline if the impact did anything.
- Actions: Here I list any outstanding ideas or suggestions from the team in markdown todo format. So any time I or my collaborators have an idea, it goes into this list, and so they can see what I've acted on and what I haven't.
It's early days, but if nothing else this document is useful for me. The notion others might read it gives me motivation to write it, but like these weeknotes the primary audience is future me.
Summary
None of the above is rocket science (it's somewhere between computer science and zoology, totally different), but for me this has been an interesting new mode of working, seeing how I can use a tool like Claude Code to help me derisk/fail-faster, and how I can do so whilst keeping both myself and my colleagues in the loop. It'll be interesting to see (for me at least) whether my ability to keep the whole pipeline in my head whilst being somewhat detached from every line of code continues to hold as the project scales up.
Yirgacheffe 2.1
Last week I mentioned a bit of work I did on Yirgacheffe based on the needs of the habitat map project, and I did a few more bits this week to help with assembling single maps from tiles that are in multiple different projections.
One of the more interesting bits (to me) was implementing the take operator, which takes a geospatial layer and an array of values, and then the pixels in the source layer are used to index the array, and the value found is in the resultant pixel - basically it's a look-up table operator. As with most operators, it is modelled on the Numpy operator of the same name. This same operator also exists in MLX, which is a Python library made for Apple that is Numpy compatible but will use Metal GPU acceleration when ran on Apple hardware. Where it gets interesting though is that MLX and Numpy have slightly different semantics of what happens when your input layer has indexes that exceed the array, but I want Yirgacheffe to perform the same on both CPU and GPU.
In the end I had to add code to the GPU path, slowing it down, so that I could get consistent behaviour. My hand was slightly forced on this as the MLX out-of-bounds indexing behaviour is described as undefined, so I can't rely on what it does today being what it does in the future. It does raise the question of why do I support two different backends in Yirgacheffe (Numpy for CPU and MLX for GPU) when in theory MLX has a CPU backend also. Initially it was because MLX was quite young when I started using it, but I get the sense it's more mature and certainly Apple keep updating it. But at the same time, if I was told one of the two projects had stopped development and I had to guess which one, I'd say MLX every time, as I just don't trust Apple not to get bored and do something else - they are very proactive at deprecating and removing APIs.
So for what feels like an uncommon operator, I think I made the right choice, but it is interesting to occasionally reconsider why one spends so much effort on decisions made several years ago.
This week
- Looks like I might be giving a demo of the habitat mapping work next week in Cambridge, so I'll try and come up with a nice landing point for this work by the end of the week - not that I'll be finished, but making sure I have a story to tell if I'm presenting it.
- Blogging: I need to write up my Nordic-RSE 2026 conference report still
- Geotessera changes: I had to fix a couple of things in Geotessera for my particular use case last week, and now I need to work out if they're worth upstreaming given that there's a big rewrite under way to move the pipeline from Numpy arrays to xarray.