Weeknotes: 5th October 2026
Habitat maps
My plan was to do a semi-global run this week, but to get there I ended up with a stack of small steps towards that which instead took up the time.
OSM downloads to Overpass
Up to now I've been accessing OpenStreetMap (OSM) data by doing region specific downloads from Geofabrik. Obviously I could just scale this up and download ALL TEH REGIONS!, but instead I turned to another option. Colleague Anil Madhavapeddy has been setting up a local OSM mirror with Overpass server so we can query the Overpass API to our hearts content without hitting limits on the public version and/or annoying people.
The main interesting thing here for me was I'd not considered that the country specific downloads actually miss out overlapping/enclosing polygons that are not entirely within the download area. For my use case, where I'm trying to find very local things (forests, parks, etc.) this won't make a huge difference, particularly as I've mostly been focussed on island nations (UK, Madagascar), but if I had done this for say Austria, then there's a chance I'd have lost items that crossed the border. With access to a full global dataset I get those.
Spatial density reduction
One concern I've had for a while is about data density being non-uniform across the globe. That is to say, in a single year of GBIF observations I get more species occurrence data in the UK than I do in Madagascar in ten years. This is also true in OSM data, whereby the UK has high coverage and Madagascar has very little. There's quite a lot written in academic literature about the perils of such data biases, and so before scaling to a global run I wanted to look into this. It also relates to performance, as my current implementation of the map generation is O(n^2), so thinning out the data has some other benefits.
To this end I read a bunch of papers around this problem, including some recommended by colleague Aneesh Naik who's been looking into similar things for his own habitat map and Species Distribution Modelling (SDM) work. Some papers what I read (or at least skimmed):
- The Effects of Sampling Bias and Model Complexity on the Predictive Performance of MaxEnt Species Distribution Models by Syfert, Smith, Coomes, 2013
- Correcting sample selection bias in maximum entropy density estimation by Dudík, Schapire, and Phillips, 2005
- Sample selection bias and presence-only distribution models: implications for background and pseudo-absence data by Phillips, Dudík, Elith, Graham, Lehmann, Leathwick, and Ferrier, 2009
- Environmental filters reduce the effects of sampling bias and improve predictions of ecological niche models by Varela, Anderson, García-Valdés, and Fernández-González, 2014
- Spatial filtering to reduce sampling bias can improve the performance of ecological niche models by Boria, Olson, Goodman, and Anderson, 2014
The tl;dr here is that the papers covered three approaches,
- Synthesising data statistically to fill in the gaps
- Using environmental data to help thin out samples with the same context
- Using sample density based on location to thin data
For this application, where we're already using the Tessera foundation model to fill in gaps, I feel that's already doing some level of statistical gap filling, I don't need to do it twice. The environmental approach from Varela et al 2014 I quite liked, but I don't currently have the data to drive that. So in the end I went with plain old geospatial filtering based on Boria et al 2014. That's not to say that I've picked the best one, just that I don't see this as the biggest risk factor in the success or failure of this work, so I felt just picking one and moving on was a good start. The main thing I got from the papers was that which one performs best is subject to the application (Varela et al found their application was worse for just plain geographic filtering rather than environment filtering), so to do this properly you need to actually try them and work out what's good for your application - which is another reason to start simple and iterate.
However, I'm not just doing a naive transplant of the Boria et al method. Whilst I am dividing occurrences into an even sized grid, and then thinning per grid cell, I'm trying to be a bit more smart than that:
- Within each cell I bucket by habitat of the occurrence, and keep one sample of each habitat, so we don't lose habitat resolution this way.
- To thin down the values within a cell I use the Tessera embedding value to pick the one with the average smallest distance to all other embeddings
That last step could definitely do with improvement, but again, not the biggest risk in my pipeline right now, so it gets added to the todo list to revisit if I ever get a global map that I'm somewhat happy with. The idea is we're picking the most representative value, but I think if there were more hours in the day I'd actually take a histogram of all samples, throw away outliers (as incorrect input - i.e., bad data in GBIF), and take the embedding values that are in the histogram peaks and keep those (as there might be young and old trees for example).
So, definitely more work to be done, but I had bigger problems to de-risk (see next section for short term, and longer term it's can I get something end-to-end that isn't hot garbage before I improve on it incrementally).
However, one last note on this is that having ran this on both UK and Madagascar with 100 metre cells, I actually saw samples drop off in Madagascar more than in the UK, despite the UK having two orders of magnitude more data! This I believe is because in Madagascar you're seeing most occurrences happen in tourist hot spots, so you're just getting repeated samples from the same location. Basically the data is less well distributed in Madagascar than it is in the UK, which makes total sense (to me). So this is a win, but not quite the win I'd naively hoped it would be at the start, and I still have a disproportionately larger set of samples in the UK than in Madagascar.
The thinning has had an impact on the habitat map of the UK, in a bemusing way: more bogland around Lewis, Sutherland and Caithness. Looking at the map this seems okay - though I'd need to track down a local expert to comment on it^W^W^W^W^W^W^W^Wgo there on my motorbike and check, you know, for science.
Dealing with performance issues vs my own confidence
One recurring challenge in this work has been the variable performance of accessing the Tessera data via source.coop using the geotessera Python package. For those not familiar with the context here: Tessera is a global machine learning model that operates at a resolution of 10 metres per pixel and covering many years, all of which means there is a lot of storage required, more than we have at our disposal in our research group, despite having some quite significant storage servers. The solution to this is that the full global storage set is stored on S3, and we access it that way. Between the University's fast network links, source.coop using a CDN, and local caching, in theory accessing Tessera like this should be close to what we'd get from one of our own local storage servers.
The problem I've faced is that seems to be true sometimes, but more often than not I get significant fall off in performance to the point where at times it's just not worth trying. The issue seems to coincide with US working hours, and so I try to get my work in early on in the day, but when a run takes a couple of days to process it doesn't really matter when I start it. I hit this again last week, and I just decided enough was enough I have to solve this or there's no point trying to do a global run when doing a UK run will vary between an hour and seven hours depending on when I start it.
I've reported this in a bug report previously, but truth be told I've felt very uncomfortable about this because the code I'm running when I hit the issue is generated via Claude Code. I wrote a month or so back about how on this project I was actually trying to use Claude Code to see if I could find a way to work with it that I felt comfortable with. The key seemed to me to be not giving the overall pipeline over to the code generation tool, but rather I'm still setting the overall structure of the pipeline I'm building, and using it to generate specific individual transform stages, so that I can still have a strong mental model of what is going on.
However, that's been thrown into question by this constant performance challenge, as I don't really know what's going on because I didn't write the code. Anil, quite rightly, asked me to file a bug on the issue so that it could be looked at, but I've felt very uncomfortable doing so on the say-so of a coding agent. For all I know it could just be holding the tooling wrong, even though I have given it full access to the Geotessera source code and the "skill" for using it. Ultimately, if I'm going to waste people's time, I want to know I've put in some time first, and no matter how much telemetry I got Claude Code to generate I still felt I didn't really know what the source of the problem was.
So on Friday I just spent the day learning what exactly is going on under the hood with the Geotessera stack, and the end result is that I've actually realised I don't need the Python package at all, I don't need to use the CDN and am going directly to the S3 store, and this combined with being able to optimise my code based on the storage model I see that is being used at source.coop, I've actually got the initial problem stage down from taking a worst case 7 hours to just ten minutes.
Under the hood, the source.coop storage is based on Zarr a chunked n-dimensional array storage format. There is also an index held in a Parquet file.
The first win I realised was that just opening the Parquet index file on S3 takes two minutes using Pandas, the standard numerical data frame library on Python. So one suspicion I have on the performance problem, is that accessing the index repeatedly is happening slowing things down. Thankfully I realised two things:
- I can use the aws cli tools just to clone the entire index locally. It's only 135MB, which is peanuts on a pipeline like ours. Once cloned access is instantaneous.
- The way the raw data in the Zarr files is stored means I don't need the index anyway :)
The data within the Zarr files is stored based on a hierarchy of structure. First the data is split by UTM zone, which allows each different area of the globe to be stored with much less distortion than if it was all stored in a single map projection. The data is then also split up by year, important if you're doing temporal analysis, though I'm not currently doing that. Then finally within that the data is broken up into a set of tiles that are themselves stored as a series of 256x256 pixel chunks. For completeness there is a icechunk index wrapping the zarr store, which provides some enhanced metadata. However, for my use case that's not important, other than I use it to find the zarr store from the source.coop published icechunk index - but once I've done that I'm using zarr directly.
The main problem I was having was with the occurrence refinement stage, where I look up the Tessera embedding value for hundreds of thousands of points, which was by far the main pain point. Because now I have access to the underlying chunk structure in zarr, I rewrote this to take the occurrences, process them to go from lat,lng coordinates to UTM Zone, and then chunk index within that zone, and sort based on the zone/chunk column, and so now I only fetch chunks once, and I have no need for the index to do this, as it's all simple math to figure it out.
So now I've actually managed to eliminate the Geotessera library from my project, and by going direct I'm (currently) seeing a significant performance improvement. Now, just because it was good on a Friday afternoon, doesn't mean I've won. But now I have my own direct version, I plan on trying to run both versions periodically during the coming week to work out if it's the underlying S3 access that's problematic, or something further up the stack.
There's two meta points here of interest, beyond just trying to escape the performance issues I was seeing.
Firstly, whilst as a software "engineer" I always feel good about removing a dependency on a third party library, I don't see that as a win here. Geotessera isn't aimed at me anyway: it's aimed at ecologists who shouldn't be expected to go understand CDNs, S3, geospatial data formats like zarr, and so on. They need to be spending their time working out how we're going to save the planet not how to restructure their dataframes to align with on disk formats. So it's not good enough to say "it works for me" and move on. Once I have more data I need to get that to the Geotessera team so that they can work in improving this for the people who matter more.
Secondly, it's a good example of how my brain works ultimately. My use of Claude Code, which I will continue to use for this project, is predicated on its focussed application so that I can still have a mental model of what's going on at all times, as that's how I like to work. At some point you do have to let go: is it when you use a third party library? is it when you call a function on the operating system? is it when you trust the floating point extension of the CPU? There is always some level of abstraction at which point have to trust things work. But when they go wrong, I've generally relied upon being able to quickly understand why: oh, it's in that library I'm using, I'll just read the code or write a unit test or talk to a person that knows better. With coding agents I feel very exposed when things go wrong, as I don't have any real understanding of where things are going wrong, and because I've been distant to the actual code that is exercising the bug, there's a higher activation energy required to start understanding it.
I'm not expecting this observation to be a revelation to anyone, but the point of trying to do a coding agent first development workflow on this project is to try teach myself where and when this workflow works for me and where it doesn't. Ultimately I think I enjoy programming, and low level programming, because I like understanding the details. But I also like being a manager on a project as I like being able to build out further than I could as an individual, and coding agents somewhat give you that advantage, except when things go wrong there is no other detail-orientated person that you're managing to dig into it and understand why. I personally feel very uncomfortable telling people they have a problem based on the say so of a coding agent, so I guess I need to mentally budget that although coding agents help speed up some aspects, there will be a cost to be paid at the inevitable break down points. My method of targeted application of coding agents in this pipeline helps constrain that, but doesn't remove it.
But I feel for projects like Yirgacheffe, which I build other pipelines on top of and the point is it's doing the hard math for me, I feel glad that these are still hand written where I can understand it all (or at least quickly page it back in). A lot of my confidence in building pipelines fast on top of Yirgacheffe comes from having a high level of belief in what I've built there.
Part II Project student
On the topic of Yirgacheffe, it looks like I'll have a final year student to supervise that is keen to look at some of the resource management issues in Yirgacheffe, which is exciting news. There's a whole bunch of untapped work here that I've wanted to do for ages and never had time, so having someone start to dig at these is going to be fun.
Urban environment exhibit
Continuing from last week's look at the Fire & Ice exhibition as art overlaps the politics of geospatial work, this week I went to see the Wide Angle View exhibition at the Royal Institute of British Architects (RIBA) in Liverpool. This exhibition covered photography from the Manplan series of magazines they published in 1969/1970. These were special editions of their Architectural Review magazine that focussed not just on the buildings, but on the interaction between people (despite the sexist title) and buildings. The photography was amazing, and well printed. Rather than use architectural photography experts they had gone to regarded street photographers in large to capture how people lived in this built environment, making for some quite powerful images.
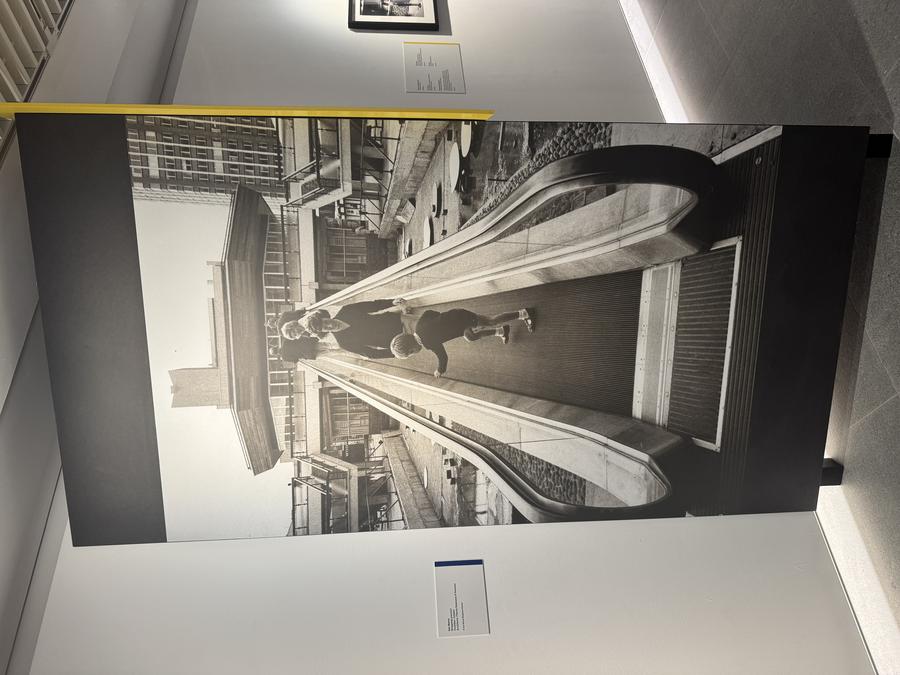
I think what was interesting to me was I felt a definite disconnect between what it was implied we were meant to feel upon seeing these images in the year they were published, versus what I felt looking at them today. A lot of the "better life through modern building", aka brutalism, vs the old brick factories being seen as a rotten core to be replaced as soon as possible now feels very misplaced. There was a photo of some miners in a locker room and a text blurb about how they had these legacy dead-end, no-hope jobs with the implication that this futurism was going to save them, but then I feel this is the work-style that deliveroo and uber eats riders now have inherited - jobs below the API as Adrian McEwan pointed out as we considered the photograph. I had to look up this reference:
There’s a model of the modern economy that separates jobs into two kinds: those above and below the API. Algorithms are replacing middle management, and if you don’t have a job telling computers what to do, sooner or later your job will consist of doing what computers tell you.
I guess the old API was just energy, in which case it's the same argument back then and now. Technically Claude Code didn't tell me to do the debugging detail for it, but if you squint enough you can start to see that framing coming.
The point here with yet another art exhibition review in a supposedly tech orientated set of weeknotes is that once again, technology and now it is "applied to people" is political, and we technologists always need to try keep that in mind. It was true twenty years ago when we failed to see it and built the closeable internet, and so it's something I need to keep trying to remind myself of now.
This coming week
- Back to the global run efforts now that performance issues are algorithmic and not ghosts in the machine.
- Wait to hear back from Ali if she's happy with the final round of LIFE maps I generated the other week, and if so get those up on Zenodo and Anil's new LIFE explainer site
- FOSS4G:UK is next week! In my head I had another week to prepare, so I really need to nail down my talk, particularly as I've had to beg them to let me go off-piste and give a demo rather than submitting a PDF of slides ahead of time. They've made it clear there is no sympathy for anything going wrong, so I really do need to get this nailed down.
Tags: weeknotes